Setting Up Your Office > Dailies Preferences > Designing a Dashboard
 Designing a Dashboard
This topic covers:
Designer dialog
Dashboard Pages are created and edited in the Dashboard Page Designer. The designer allows you to select, place, resize, and color your Tracking Appt Adjournments choice of Dashboard elements. Dashboard Pages, like other Dailies Pages, may be viewed by selecting them in the navigation list of the Dailies module.
| Note: To create or use Dashboard Pages, SQL Reporting Services must be installed and configured for the firm by your Amicus Administrator. |
For example, navigating to the My Desktop 1 view of Dailies might display the following Dashboard Page:
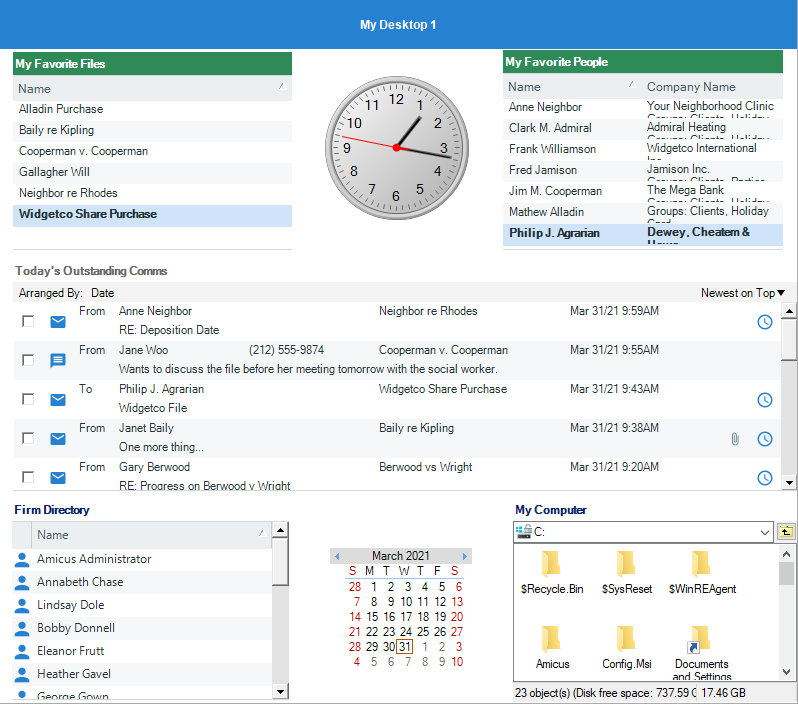
Some sample Dashboards are provided by default. These samples can be used as is, or as the basis for new Dashboards you create, but they cannot be deleted.
Dashboard elements
There are many elements (Data Views) to choose from for inclusion in your Dashboards:
-
Data List Views—Various data list views are available: Today's To Do's, Today's Outstanding To Do's, Today's Appointments, Today's Outstanding Comms, Unread Communications, Today's Time Entries, Unposted Time Entries, My Favorite Files, My Favorite People, and Firm Directory. These lists provide standard functionality such as sorting, printing, adding new items, and opening details for viewing or editing.

-
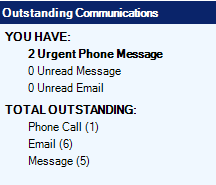
Summaries—These views provide a summary of underlying data. For example, the summary view of Outstanding Communications shows only the number of unread e-mails, unread phone messages, etc. Other view are: My Time Stats, Stickies Received Today, and Message of the Day. This type of view still offers the ability to navigate quickly to the details of the relevant module.
-
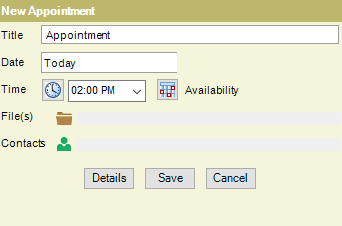
Instant Data Entry—These views provide "mini" versions of new record items: Appointments, To Do's, Time Entries, and Notes/Stickies. They allow you to quickly create frequently added items from your Dailies module.
-
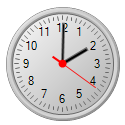
Tools—Adding a Clock, Date Display, or month view Mini Calendar to your Dashboard provides the date/time at a glance throughout your day. Other tools are: Amicus Date Calculator, Basic Search, and Run a Saved Search.
-
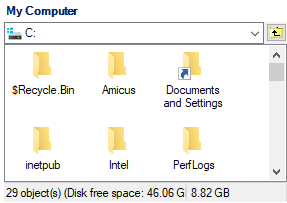
Other—To include portal functionality in your Dashboard you can add an embedded browser that displays your favorite website. Include a network folder that you frequently use. You can even configure a section to run a frequently used program with a single click. You must specify a Data Source attribute (e.g. Web page address) for each of these elements.
Opening the Dashboard Designer
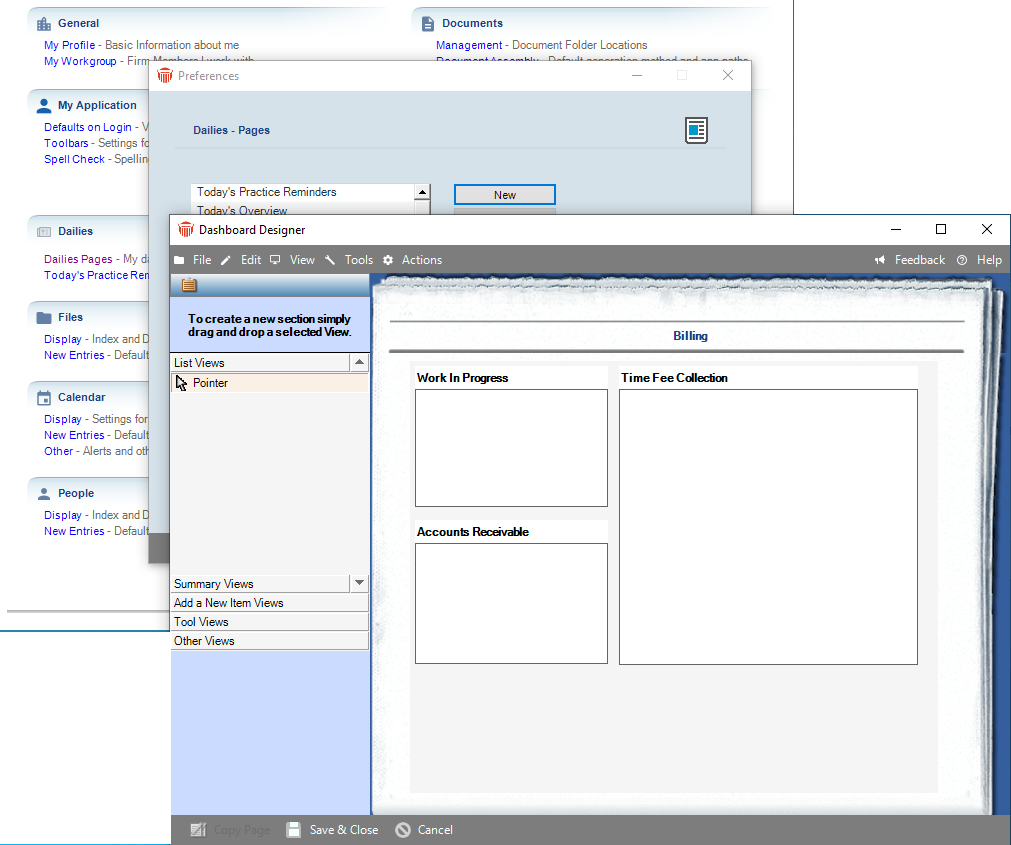
To open the Dashboard Designer, go to Office > Preferences, and select Dailies Pages under the Dailies heading. Then add a New page or choose one to Edit from the Dailies - Pages Preferences window.
 |
Tip: Screen resolution—To design Pages effectively, your monitor should be set to the lowest resolution typically employed at the computer where you log in—e.g. if set to a 1024 by 768 pixel display, you should design at 1024 by 768 pixels. If you design at a higher resolution than you normally use, some Sections might not display properly. Sections will resize according to your current resolution but the results might not be as desired. |
Adding Sections
You may add one or more Sections to the page. Each Section represents a Data View. The control panel at the left displays the lists of available Data Views, detailed above.
Display the appropriate list in the control panel, drag it to the right, and drop it in the desired position. A Section displaying that Data View is created automatically.
Moving or resizing a Section
To move a Section, select it on the page and drag it to its new position.
To resize a Section, select it on the page. Then select a graphic handle and drag it to increase or decrease the size.
 |
Tip: Multiple Sections may be selected and then moved or resized together. |
Editing the attributes of a Section
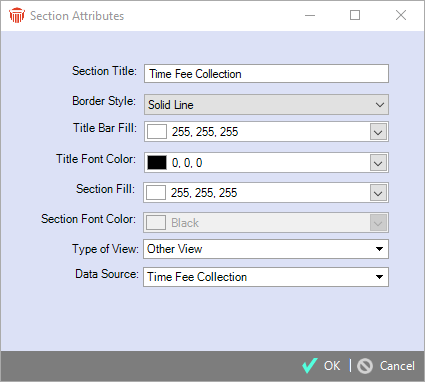
To view or edit the attributes of a Section, right-click it on the layout and choose Show Section Properties in the shortcut menu that appears. This opens the Section Attributes dialog.
| Attribute | Description |
| Section Title | Title of the section, up to 35 characters. |
| Border Style | Style of border for the section, no border, solid line, or 3D line. |
| Title Bar Fill | Fill color of the title bar. |
| Title Font Color | Color of the title in the title bar. |
| Section Fill | Fill color of the body of the section. |
| Section Font Color | Color of text in the body of the section. |
| Type of View | List, Summary, New Item, Tools, Other - Web/URL, Other - Win Explorer, or Other - Run Program. |
| Data Source | Defines the data that willappear in the section. For "Other" Data Views, the Data Source is manually entered and represents the targe path or address. |
Deleting a Section
To delete a Section from a Page, select it from the layout in the Designer dialog and then either right-click and choose Delete Section or press the <DELETE> key.
Editing the properties of a Dashboard Page
To view or edit the Properties of a Dashboard Page, right-click an empty area of its Designer dialog and choose Show Dashboard Page Properties on the shortcut menu that appears. The Dailies Page details dialog appears.
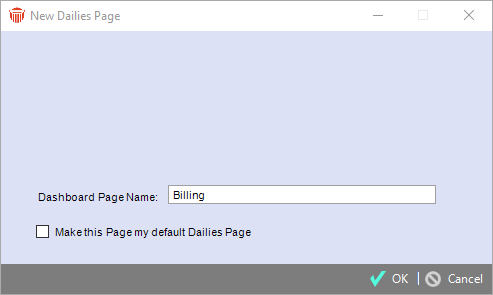
Edit the Page Name if desired. You may also select or clear the option to make this Dashboard your default Dailies view.
Previewing the Dashboard Page
To test your design, click Preview to preview the Dashboard Page in a separate Dailies-like window with live data.
Related Topics
